Ayla Insights: Datapoint Analysis
The Datapoint Analysis reports (example below) enable you to gain insights on the datapoints transmitted by your users’ devices. You can use these reports, for instance, to understand the distribution of a datapoint value across your device population. For example, if your datapoint is for a temperature sensor, you could analyze the distribution of temperature values across your devices. Notice in the example below that one of the basic filters for these reports is Datapoint Name. There are also additional filters you can use in these reports.
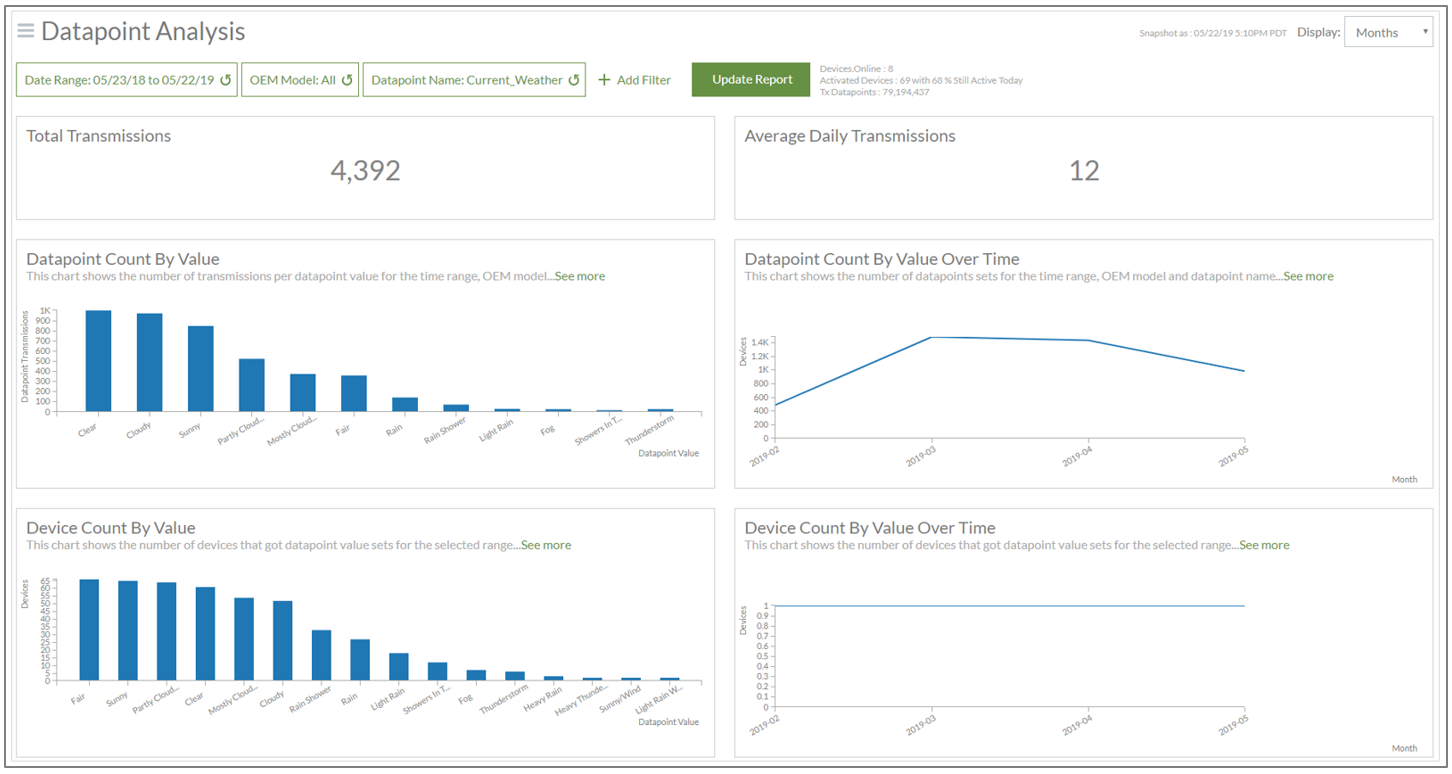
Following are the six individual reports in this set: (Click each for a description.)
This individual report (example below) provides the total number of data transmissions. This value is based on the date range and OEM model selected in the filters. A transmission is when a device sends one or more property values to the cloud.
![]()
This individual report (example below) provides the average daily data transmissions sent. This value is based on the date range and OEM model selected in the filters. A transmission is when a device sends one or more property values to the cloud.
![]()
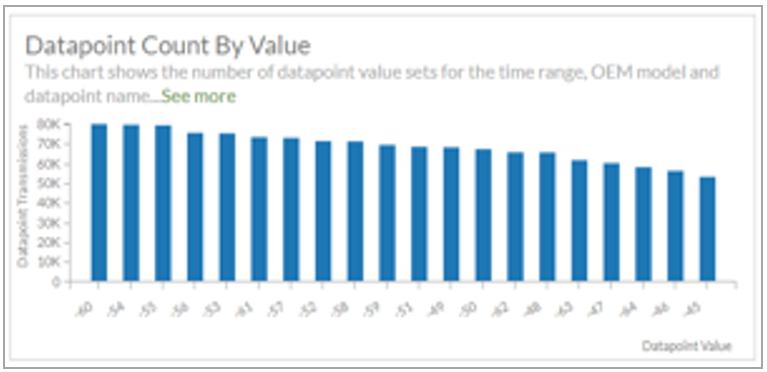
This individual report (example below) provides the total number of datapoints attributed to the selected device property or properties. The datapoint in this example is Wi-Fi Signal Strength values (specifically RSSI – Received Signal Strength Indicator). As shown in the example below, most devices have an RSSI of -60, -54, -55, etc.
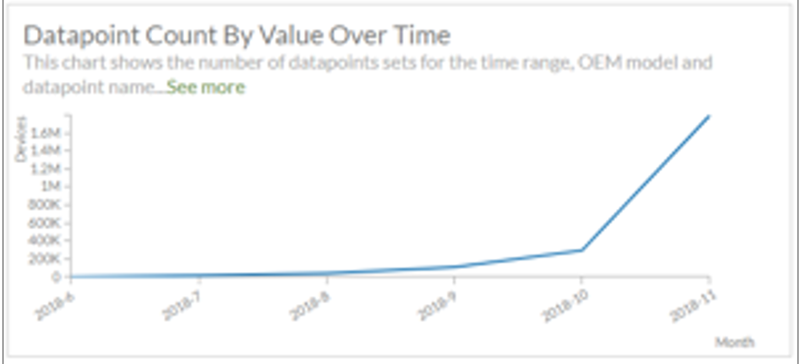
This individual report (example below) provides the total number of datapoints attributed to each value of a device property or properties shown over a period of time. The datapoint value in this example is Wi-Fi Signal Strength (specifically RSSI – Received Signal Strength Indicator). The example below shows a steady increase in the Wi-Fi Signal Strength datapoint set over the time period selected in the filters for this report set.
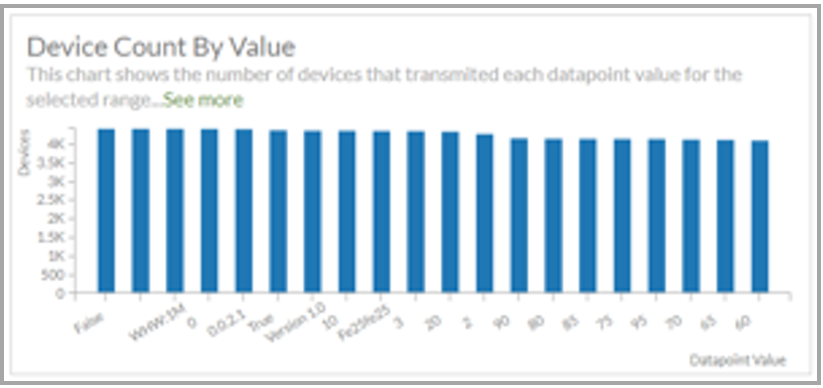
This individual report (example below) provides the total number of devices that transmitted each datapoint value for the datapoint, date range, and OEM model selected in the filters applied to this report set.
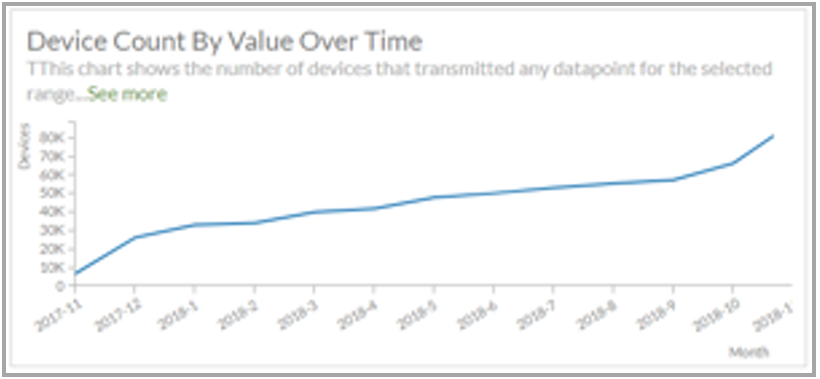
This individual report (example below) provides the number of devices that transmitted any datapoint value for the datapoint, date range, and OEM model selected in the filters applied to this report set.
How to get here on the dashboard: Click Ayla Insights in the Navigation Panel, sign in to Ayla Insights, then click Datapoint Analysis in the Navigation Panel for Insights.
See also: Ayla Insights, Insights Overview Reports, Insights Onboarding Analysis Reports, Insights Device Trends Reports, Insights Device Software Analysis Reports, Insights Device Transmission Analysis Reports, Insights Device Details Reports, Insights User Analysis Reports, Insights Notification Analysis Reports, Insights Datapoint Transmissions Trends Reports.
Please click here to let us know how we're doing. Thank you.